VIStory: Interactive Storyboard for Exploring Visual Information
in Scientific Publications
Ao Dong
Wei Zeng
Xi Chen
Zhanglin Cheng
The 12th International Symposium on Visual Information Communication and Interaction (VINCI 2019) Figure 1: VIStory interface for exploring a
collection of scientific publications. (a) The Faceted View enables efficient query
of publications through multi-faceted metadata of venues, authors, and keywords. (b)
The queried publications are encoded as glyphs arranged in a themeriver layout to
depict temporal trends in the Storyboard View. (c) The Endgame View presents a
highlighted figure along with information of the publication.
Shenzhen Institutes of Advanced Technology,
Chinese Academy of Sciences
Abstract:
Many visual analytics have been developed for examining scientific publications comprising wealthy data such as authors and citations. The studies provide unprecedented insights on a variety of applications, e.g., literature review and collaboration analysis. However, visual information (i.e., figures) that are widely employed for storytelling and methods description are often neglected. We present VIStory, an interactive storyboard for exploring visual information in scientific publications. We harvest the data using an automatic figure extraction method, resulting in a large corpora of figures. Each figure contains various attributes such as dominant color and width/height ratio, together with faceted metadata of the publication including venues, authors, and keywords. To depict these information, we develop an intuitive interface consisting of three components: 1) Faceted View enables efficient query by publication metadata, benefiting from a nested table structure, 2) Storyboard View arranges paper rings ∫ a well-designed glyph for depicting figure attributes, in a themeriver layout to reveal temporal trends, and 3) Endgame View presents a highlighted figure together with the publication metadata. The system is especially useful for scientific publications containing substantial visual information, such as the visualization publications. We demonstrate the effectiveness of our approach using two case studies conducted on past ten-year IEEE VIS publications in 2009 - 2018.Techniques:
Figure 2: Number of figures included in VAST, InfoVis, and SciVis proceedings in 2009 - 2018.
Figure 3: A nested table structure that organizes all figures according to publication metadata and figure attributes.

Figure 4: Paper ring glyph for [20]: Arcs in clockwise layout depict figures in a paper, with arc length for figure size, arc height as w/h ratio, and color as domain color.
Figure 5: A greedy algorithm for deciding radius of paper ring. r1 is chosen in (a) while r2 is chosen in (b).
Results:

Figure 6: Author profiles of top visualization researchers in mainland China who contributed most publications to IEEE VIS publications in 2009 - 2018, i.e., {Shixia Liu, Xiaoru Yuan, Yingcai Wu, Wei Chen, Weiwei Cui, Nan Cao, Yunhai Wang}. Notice that Huamin Qu, Hanqi Guo, and Mengchen Liu are not in the selection list, but still appear in the view.
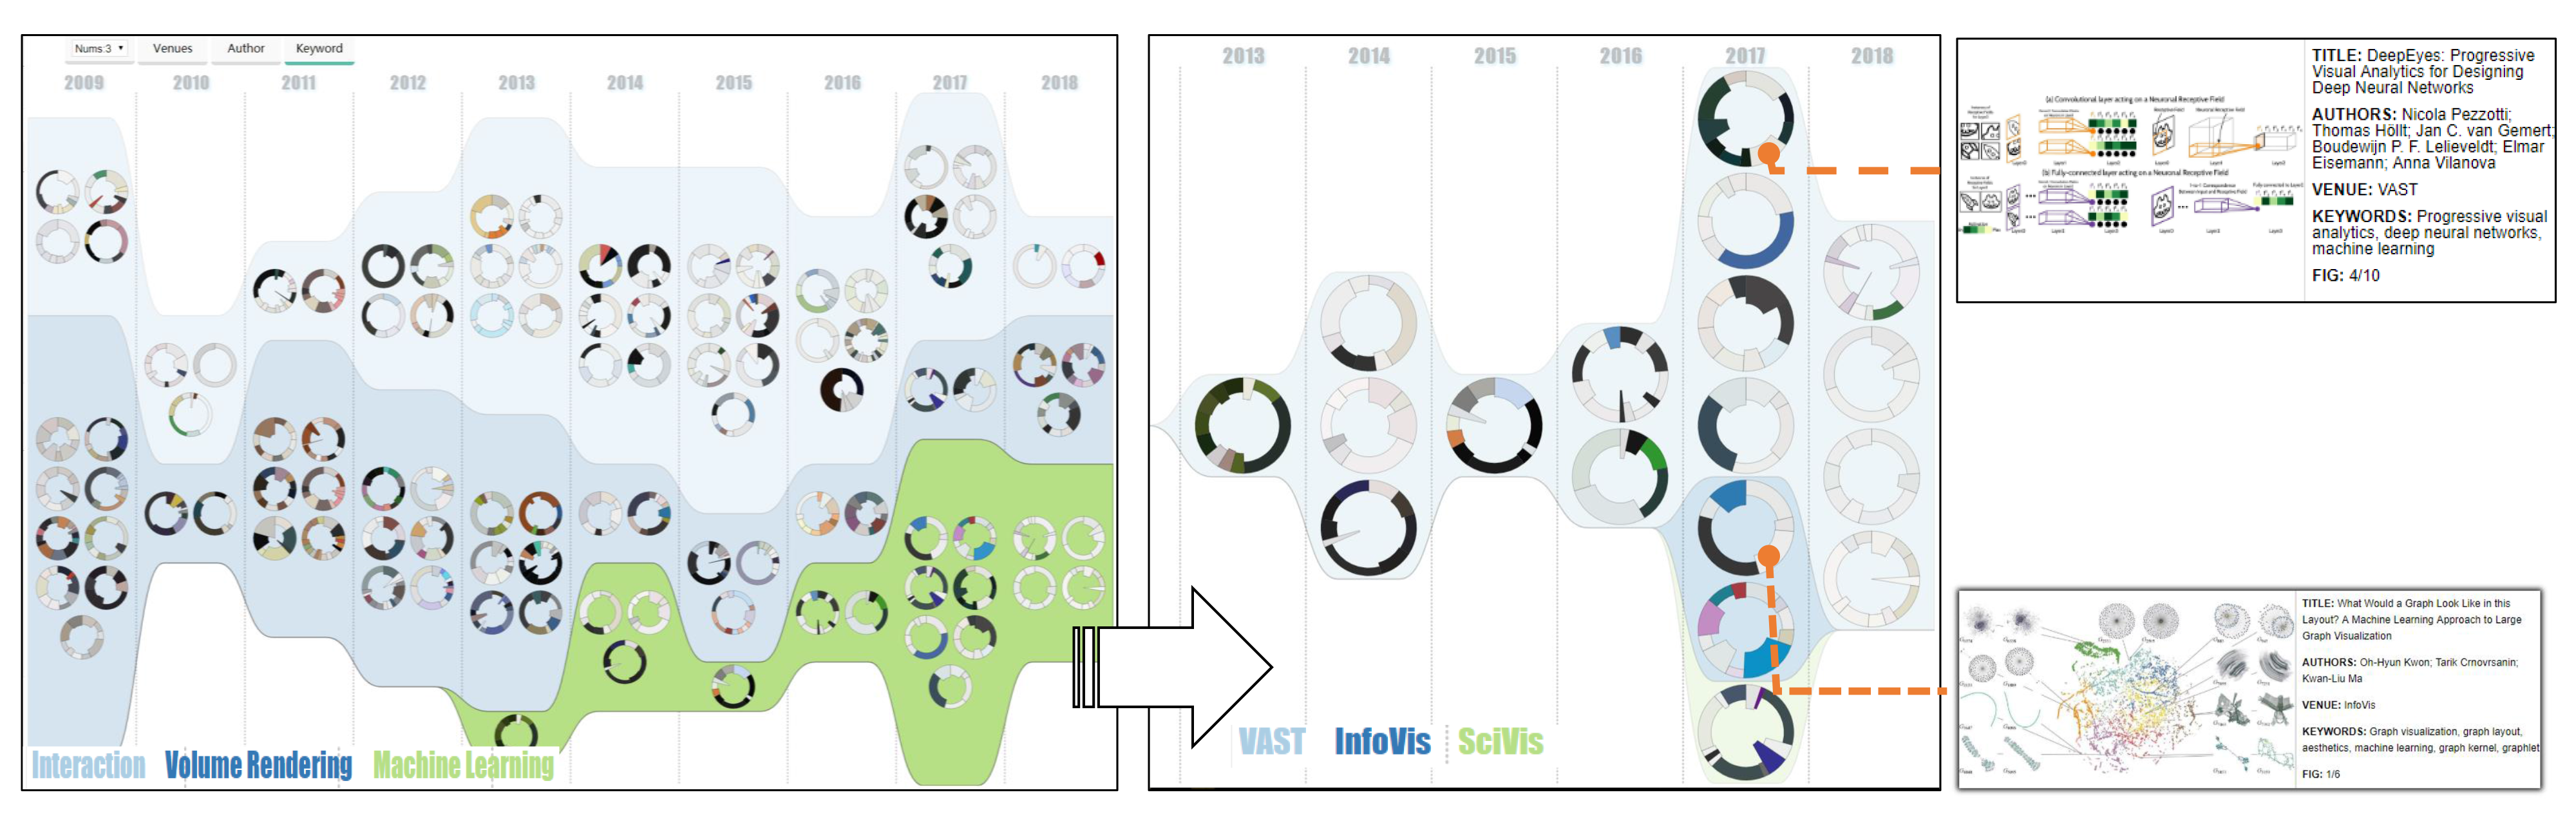
Figure 7: Exploring trends of visualization topics of Interaction, Volume Rendering, and Machine Learning in 2009 - 2018. Left: Number of publications on interaction remains stable, on volume rendering is decreasing, while on machine learning gets popular. Middle: Closer examination of publications on machine learning shows that most publications are in VAST conference. Right: Top Endgame View shows that the VAST paper is to explain CNN, while the bottom view shows a InfoVis paper utilizing machine learning to facilitate graph layout.
Acknowledgement:
The authors wish to thank anonymous reviewers for their constructive comments This work was supported in part by National Natural Science Foundation of China (61802388), the CAS grant (GJHZ1862), and the Shenzhen Basic Research Program (JCYJ20180507182222355).